

Business model assessment
LLM Analysis
 Business model
- Competitive position
- Management
Usage: Long-term investments, quality assessment
 Stock analysis with artificial intelligence.
AI stock analysis that combines business quality, fundamental analysis and timing – for better investment decisions. Built by Experts to support better investment decisions.
 AI-powered fundamental analysis 25,000+ stocks worldwide Digital analyst
Three dimensions, one clear decision. The Leeway-Score combines all important aspects of in-depth stock analysis
Business model assessment
LLM Analysis
Business modelCompetitive positionManagementPatterns in the balance sheet
Machine Learning
ProfitabilityFinancesPrice/performanceTiming in the valuation cycle
Classic Analysis
Valuation vs. own historyCheap/expensive zonesEntry/exit windowsThe one number for your shortlist
Aggregation
Business-Rating (1/3)Market-Fit-Rating (1/3)Cycle-Rating (1/3)Chat models summarize text. Analysts cover few companies and carry bias. Leeway splits three independent questions: Business-Rating (business-model quality, LLM), Market-Fit-Rating (fundamental fit, machine learning) and Cycle-Rating (timing versus the stock's own valuation history). The Leeway-Score is the balance: one third each, not a single AI opinion.
Methodology for Business-Rating, Market-Fit-Rating, Cycle-Rating and Leeway-Score is under Help & Getting Started.
Generative AI and LLMs meet machine learning – understandable and objective.
From screening to comparison – clearly structured
Systematically narrow down 25,000+ titles – with quantitative justification.
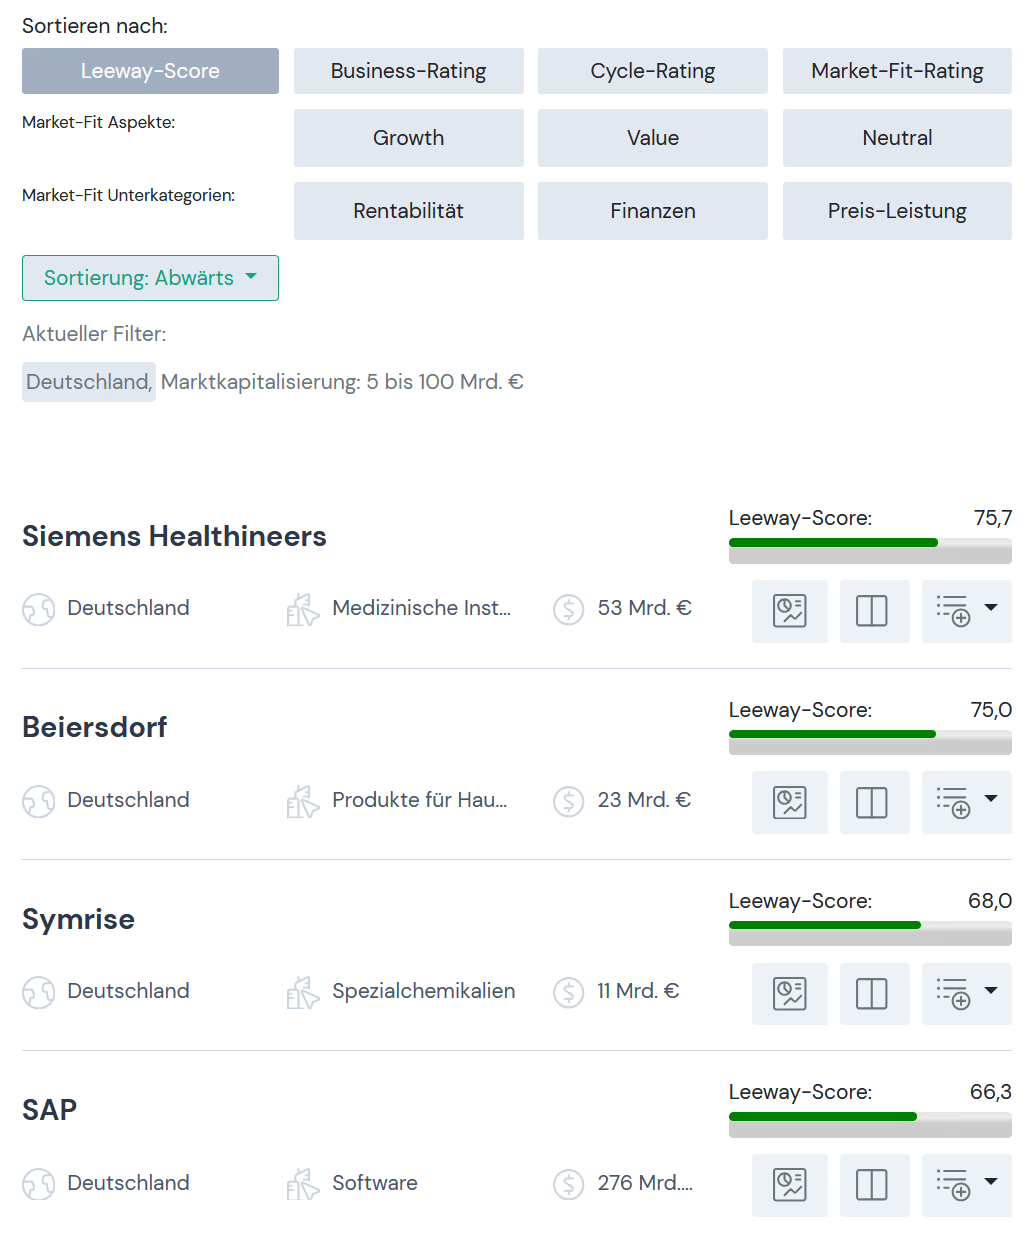
Assess business model quality – competitive advantages and structural risks.

Check fundamental substance – 18 factors for stable, above-average returns.

Timing in the valuation cycle – is now a good moment?

Identify relative opportunities and find better alternatives.

You connect Leeway to your AI assistant once, and from then on you can ask about stocks, funds and markets and get answers based on current prices, balance sheet figures and recent events. Setting it up takes about two minutes, and there is nothing to install on your computer.
The same market data is also available as a REST interface via the Data-API.

"Leeway is like having a team of buy-side analysts in-house. It reflects my way of thinking and decision-making processes and helps avoid systematic errors. Particularly impressive are the hidden insights that regularly come to light, while at the same time ensuring a quick and direct overview."
Portfolio Manager & Managing Director Avant-garde Capital, Former German Fund Manager of the Year • 30+ Years of Experience
Leading financial institutions and asset managers rely on Leeway








The information is intended to support you in your independent decision-making in implementing investment strategies and serves purely informational purposes. Past performance is not a reliable indication of future performance. No warranty can be given for the completeness, correctness and accuracy of the listed content. The information does not constitute specific investment recommendations. We neither know you nor your financial situation and do not provide investment advice. Only licensed investment advisors with knowledge of your personal circumstances may do this. PWP Leeway UG (limited liability) is not an investment advisor and does not collect any personal data for the purpose of investment optimization. PWP Leeway UG (limited liability) is a provider of investment recommendations and investment strategy recommendations. As such, it is registered with and supervised by the Federal Financial Supervisory Authority (BaFin). The legal notices on the use of the website and the General Terms and Conditions of PWP Leeway UG (limited liability) also apply.
All price data are closing prices of the respective stock exchanges. Price information and master data are provided by an external service provider. Furthermore, public trading data, such as provided by Finra.org, is used to analyze market behavior. No warranty can be given for the completeness, correctness and accuracy of the listed content.
Disclosure of interests: To the best of our knowledge, Leeway and the persons responsible for creating or publishing the respective content do not hold a net long or net short position exceeding 0.5% of the issued share capital of any issuer discussed in that content at the time of publication. There are no other interests or business relationships that could conflict with objectivity, unless expressly stated otherwise in the respective content.


