Tesla is Undervalued
At Leeway, we have made it our mission to provide investors with the most advanced tools for stock analysis. Our machine learning-based analyses have helped users identify the best stocks for the current market regime. Today, we are pleased to introduce a new feature that complements our traditional analyses: the long-term development of a company's valuation in terms of metrics such as price-to-earnings ratio or price-to-sales ratio. This feature provides a deeper understanding of a company's valuation over time and helps investors make more informed decisions.
Understanding Tesla's Historical Valuation
To illustrate the power of our new feature, let's take a closer look at Tesla. Tesla has once again attracted media attention recently. In recent months, Tesla's stock price has almost doubled, even though recent figures were viewed by many as lackluster. There was great confusion in the media and the rally was often described as irrational. However, our new valuation history shows a different picture.
Uncovering the True (Relative) Value
Our historical valuation charts show that before its recent rally, Tesla was actually undervalued by Tesla's standards. Using the metrics of revenue and book value, we can see that Tesla was near a historical low a few months ago. Therefore, the recent rally was merely a return to normality for Tesla, and within this framework there is still plenty of room for upside. The extent to which Tesla's normality is reasonable is another matter. Nevertheless, within the "Tesla" sub-universe, the recent increase was only logical. Why this claim?
Price-to-Sales (P/S) and Price-to-Book Ratio (P/B)
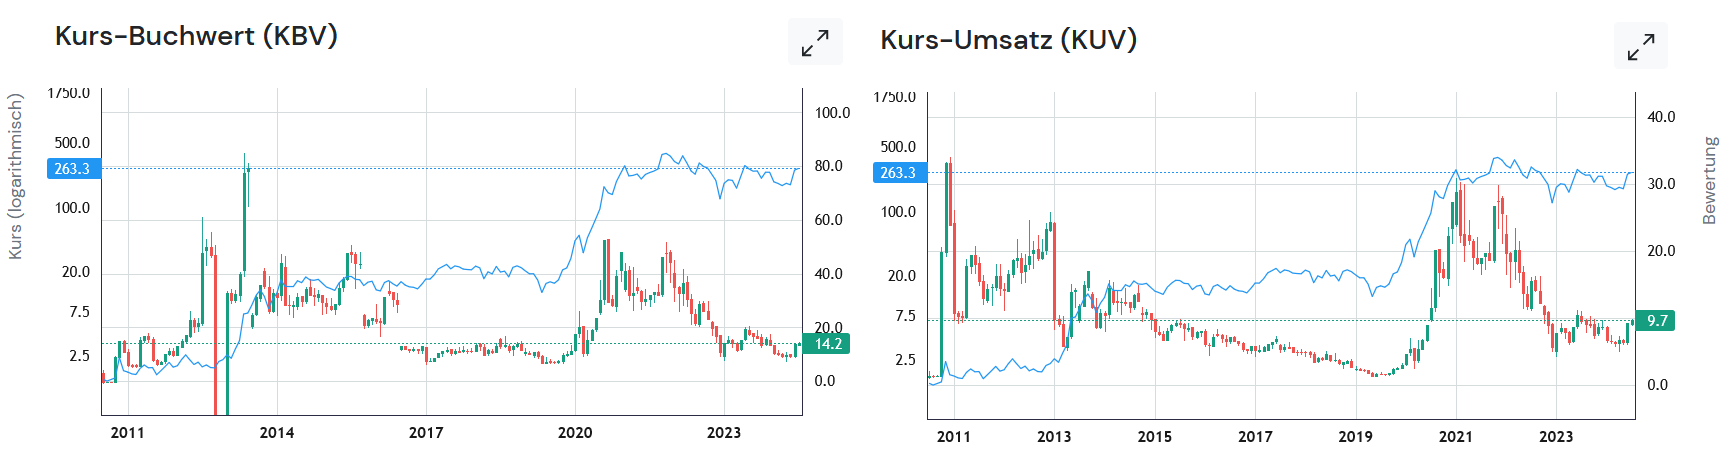
Historically, Tesla's valuation has been closely tied to the company's revenue and book value. A few months ago, both metrics were at historical lows, which relatively indicated undervaluation. This undervaluation formed the basis for the subsequent rally, as prices stopped falling and the market decided to stick with Tesla's old valuation scheme.
Bereit für bessere Investment-Entscheidungen?
Starten Sie noch heute mit Ihrer kostenlosen Testphase - Aktienanalyse mit künstlicher Intelligenz.
Volle Transparenz | Voller Zugriff | Jederzeit kündbar
Tesla's price-to-sales and price-to-book ratios had returned to the lower range of 2015 to 2020 after their peak during the 2020/2021 surge, when revenue and book value caught up with the market value increase. Tesla was historically cheap relative to its revenues and book value, making the company an attractive investment. Even now, Tesla is still far from its high valuation range.
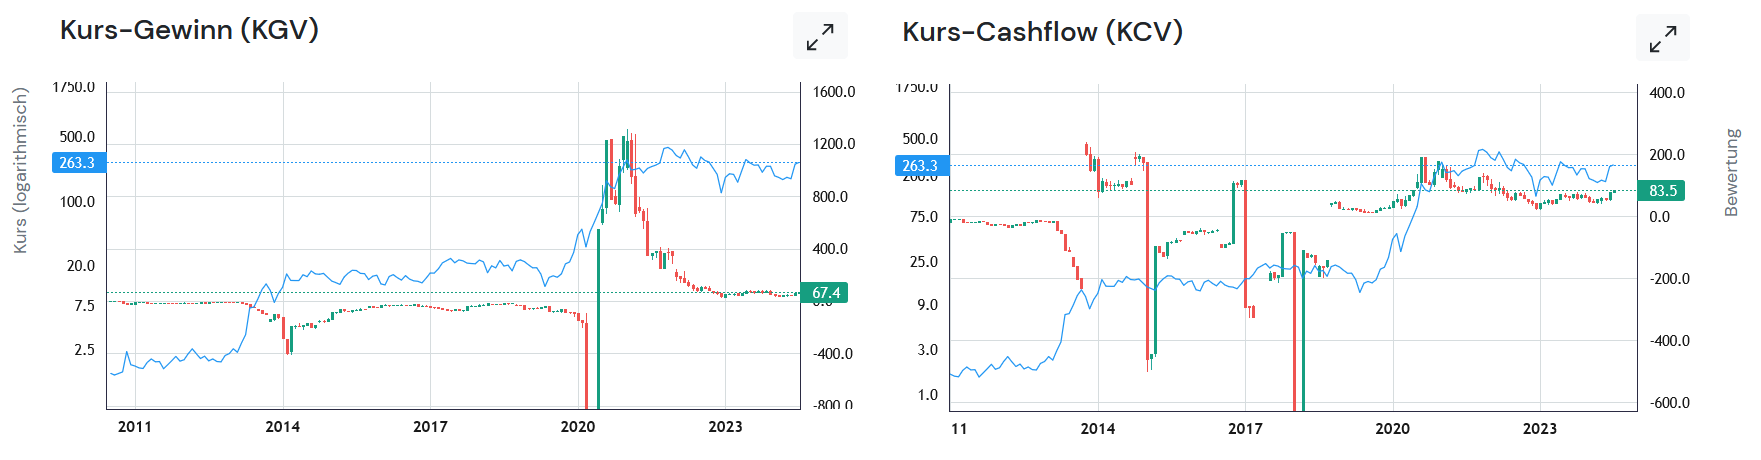
While Tesla's earnings and cash flow figures often fluctuate and appear expensive, these metrics have never been the main drivers of the stock's performance. Instead, the market has always valued Tesla based on its revenue growth and book value.
The Bigger Picture
Our new historical valuation feature provides context that is often missing in traditional analyses. In Tesla's case, it shows that the recent price increase was not necessarily irrational, but rather represents a correction of the previous undervaluation (by Tesla's standards). This insight can be invaluable for investors who want to understand the true value of a stock and its potential for future growth.
Leeway has made it its mission to provide you with the tools you need to navigate the stock markets. Our new historical valuation feature is designed to give you a comprehensive overview of a company's financial development and valuation, complementing our existing scores with an additional perspective. With this new tool, you are better able to assess at what stage of its cycle a stock is and thus make more precise and better-timed investment decisions.
You can find the histories on the detail pages of the stocks. Search for a stock or select the best one from the Rank & Screen function and go to the Valuation History tab.
Happy investing with Leeway!
Lars Wißler